Development Process
Background on the Annual Evaluation Agenda
Measure A, formally titled the Affordable Housing, Homelessness Solutions, and Prevention Now Transactions and Use Tax Ordinance, was approved by Los Angeles County voters in November 2024. The ordinance established a countywide one-half cent sales tax to support housing, homelessness services, and prevention efforts, and repealed Measure H. Unlike Measure H, which focused primarily on the homeless services system, Measure A explicitly spans housing production, prevention, rehousing, behavioral health, and system coordination. Importantly, Measure A also created a dedicated funding stream for evaluation and accountability by allocating 1.25 percent of total revenues to Accountability, Data, and Research (ADR), including data collection, outcome measurement, and evaluation.
Measure A requires the County to establish and manage an Annual Evaluation Agenda (AEA) as a core accountability and learning mechanism. After considering recommendations from the Executive Committee for Regional Homeless Alignment (ECRHA) and consulting with appropriate County agencies and departments, the County is directed to “establish and manage an annual evaluation agenda to spur innovation and improvement,” with a specific emphasis on evaluations that “test the causal impact of investments on the desired outcomes.” The ordinance further requires that evaluations include a third-party evaluator selected through a request for proposals (RFP) and that evaluations “include voices with relevant lived experience.” The Evaluation Agenda is explicitly linked to Measure A’s performance management framework. By October 1, 2031, new baseline and target metrics must be formulated by ECRHA and the Housing Agency, and those metrics must be “informed by the annual evaluation agenda and prior program performance.”
Approach to developing the first version of the AEA
In developing version 2026.1.0 of the Annual Evaluation Agenda, the Department of Homeless Services and Housing (HSH) intentionally adopted a bottom-up approach to avoid the blind spots and inequities that can result from purely top-down, staff-driven development of government research and learning agendas. Rather than pre-defining evaluation priorities internally, the County structured the process around two distinct phases:
A co-design phase focused on generating a broad and inclusive long list of evaluation questions by engaging governance partners, County departments, service providers, researchers, and people with lived experience. As explained below, this phase was designed to ensure that proposed questions were grounded in lived and operational understanding of where the homelessness system is failing, for whom, and why.
The subsequent prioritization phase applied structured preference-gathering tools alongside Measure A’s requirements and input on leadership priorities from governance partners, in order to create a ranked shortlist of potential upcoming evaluations. By ranking these in order of priority, we created flexibility to match evaluations to available internal capacity, ADR-funded external RFPs, and external grant opportunities, and to sequence implementation strategically as resources become available.
Co-design phase
Building a longlist of questions
During the co-design phase, we spent three months in the summer and fall of 2025 gathering ideas from people across the homelessness system in LA. We wanted a long, inclusive list of questions that reflected the experience and priorities of those who administer, fund, provide, research, and receive services. Questions were also added to the list in response to priorities of governance partners such as ECRHA and LTRHA (and their subcommittees), as well as the Homelessness Deputies and the executive leadership of HSH. In total, this process produced 291 potential questions for inclusion on the AEA.
| Source | Number of questions | % |
|---|---|---|
| Focus Group | 159 | 55% |
| Community Workshop | 79 | 27% |
| Online Survey | 20 | 7% |
| Governance Partner Consultation | 17 | 6% |
| Literature Review | 16 | 5% |
| Total | 291 |
Below are the rough counts if questions contributed based on the co-design partner. Note, these sum to more than 291 because it is not always possible to attribute a question to one kind of co-design partner (e.g., when coding notes from a community workshop attended by a mix of members of the public, providers, and people with lived experience). The bulk of our questions came from program funders or administrators, providers, and people with lived experience of homelessness.
| Co-design partner type | Number of questions |
|---|---|
| Funders/Administrators | 114 |
| Providers | 89 |
| People with lived experience of homelessness | 75 |
| Academia/Researchers | 39 |
| Members of the public | 24 |
| Governance Partner | 15 |
| Transition-aged youth (TAY) with lived experience of homelessness | 11 |
| Administrator | 8 |
| CoC | 8 |
| Cities/COGs | 4 |
Our co-design partners were the main source of questions on the longlist. To crowdsource these questions, we used four kinds of engagement.
- Community Workshops. Everexcel and Changewell ran 18 online and in-person community workshops that reached hundreds of providers, people with lived experience, municipal partners, advocacy groups, and members of the public. In total, 357 people attended the Changewell co-design workshops and 735 attended the Everexcel workshops. These workshops covered more than the evaluation agenda, but also included specific prompts on the AEA. We coded the notes from these workshops, irrespective of what topic prompted them, into potential AEA questions.
- Focus Groups. We held 21 targeted focus groups with more than 130 people with lived experience, funders and administrators, and researchers. These sessions were facilitated by the AEA team and were focused entirely on the evaluation agenda, so tended to generate more questions than other sources of information.
- Online Survey. We fielded a community engagement survey that asked respondents to tell us how they believe the system needs to improve to meet the Measure A goals and what questions would help drive that progress. We sent the survey to more than 45,000 newsletter subscribers, to all cities and councils of government, and to anyone invited to targeted focus groups who could not attend. We received 32 responses.
- Literature Review. Fourth, we reviewed existing homelessness research agendas to avoid reinventing the wheel and to capture relevant gaps already identified in the field. We focused on three major sources: the April 2020 National Alliance to End Homelessness Research Agenda for Ending Homelessness; the March 2021 Homelessness Policy Research Institute (HPRI) Research Agenda for Moving Toward an Anti-Racist System for Ending and Preventing Homelessness in Los Angeles; and the November 2023 United States Interagency Council on Homelessness (USICH) Federal Homelessness Research Agenda. These sources helped us capture gaps already documented in the literature and ensured that our longlist was grounded in what the field has determined is most important to study.
Throughout this period, we also met or otherwise consulted with our governance partners, including ECRHA and its subcommittee on Best Practices for Standardization of Care (BPSC), the Leadership Table for Regional Homeless Allignment (LTRHA) and its Equity Subcommittee, the Board of Supervisors Homeless Policy Deputies, and the executive leadership team of HSH, to make sure we understood their highest priorities. Questions related to Measure A’s innovation budget were added as well, since those programs were already recommended for evaluation as part of the budgeting process.
This effort produced a crowdsourced longlist of 291 questions. We then consolidated that list down to a non-duplicative set of 102 questions, which became the basis for the preference survey described below.
Any group or individual that provided feedback can see how their question was originally recorded by searching for it within the longlist using the instructions provided there. In addition, the evaluation agenda lists the unique IDs of all questions
Building a logic model
To ensure the questions and learning activities on the AEA drive forward progress toward Measure A goals, we organized all evaluation questions into a simple framework that reflects how the system can improve to support better outcomes.
The framework emerged from the co-design process described above, which centered the voices and expertise of people who interact with the homelessness system every day. During focus groups, community workshops, and our open survey, we asked participants to reflect on the key barriers that hold back progress on the Measure A goals and what the system needs to understand better to overcome those barriers. We used prompts such as:
- Which Measure A goal matters most to you, based on your experience?
- What gets in the way of progress on that goal?
- What is one thing you wish we understood better that would help move the system forward?
- What idea, program change, or policy shift would you want to see tested or evaluated?
- What gets in the way for certain groups in getting housing or services - and what would help remove those barriers?
The logic model has three layers. The top two include strategies that organize into which our evaluation work is organized. The first includes Cross-Cutting System Improvement: a set of strategies that shape how the entire system functions and that apply across all stages. The middle layer shows the five types of stage-specific strategies that roughly track movement through the system. These stages are a simplification used to organize learning, not a description of how any one person navigates the system: people do not move through the system in a single linear sequence, they enter at different points, move between programs, and exit through different pathways. The bottom layer shows the four Measure A Goals these strategies are expected to advance. Each strategy connects to one or more goals, and many strategies contribute to several goals at once. Underlying all four goals is an overarching aspiration: to make homelessness brief, rare, and non-recurring.

The table below summarizes our longlist into the logic model. The bulk of the questions focus on cross-cutting system improvements (38%) and connection to services (30%). Stabilization and progress through services, prevention, and long-term housing stability each account for 15%, 7%, and 7% of questions on the longlist. Finally, 3% of the questions focus on permanent housing placement.
| Stage | Strategy | Number of questions | % |
|---|---|---|---|
| Prevention | Preventing people from losing their housing in the first place | 20 | 7% |
| Connection to services | Helping people living outside come indoors | 14 | 5% |
| Connection to services | Measuring and meeting client needs | 14 | 5% |
| Connection to services | Making sure everyone accesses services and housing equitably | 8 | 3% |
| Connection to services | Providing the right support for different groups of people | 25 | 9% |
| Connection to services | Getting participants needed health and behavioral health care | 30 | 10% |
| Stabilization and progress through services | Understanding and improving participant experience of provider services | 20 | 7% |
| Stabilization and progress through services | Giving participants more voice and helping them feel connected | 6 | 2% |
| Stabilization and progress through services | Improving how people move from one program to the next | 13 | 4% |
| Stabilization and progress through services | Preventing unfavorable exits from interim housing | 6 | 2% |
| Permanent housing placement | Helping people move into permanent housing faster | 7 | 2% |
| Long-term housing stability | Helping people stay housed for the long term | 20 | 7% |
| Cross-cutting system improvement | Testing, improving, and innovating program models | 30 | 10% |
| Cross-cutting system improvement | Supporting providers and provider workforce to deliver strong services | 29 | 10% |
| Cross-cutting system improvement | Building better data to improve services | 8 | 3% |
| Cross-cutting system improvement | Getting the most impact from scarce resources | 5 | 2% |
| Cross-cutting system improvement | Reducing administrative burden | 27 | 9% |
| Cross-cutting system improvement | Improving governance, coordination, and systemwide impact | 9 | 3% |
Prioritization
Priorities used in shortlist formation
From the longlist of 291 questions, our first step is to narrow the list to about 20 evaluation questions for governance partners to review. Our goal is to end up with roughly 12 to 15 evaluations in the first version of the AEA. We use 20 as a starting point because we expect the FY25-26 and FY26-27 evaluation portfolio to include 12 to 15 internal and external evaluations funded through different sources. Eight of these are already required: four evaluations that are currently underway and four tied to programs funded through the innovation budget. We expect part of the discussion with governance partners to focus on how we move from the initial set of 20 to a final set of 12 to 15 that best reflects system priorities and Measure A requirements.
To get to a shortlist of 20 from a longlist of 274, we use the following principles, in no particular order: A. Shortlist questions should prioritize causal impact, per Measure A ordinance B. Shortlist questions must reflect priorities of co-design partners C. Shortlist questions must reflect governance partner priorities D. Shortlist questions must include evaluations that are already underway or are mandated by their inclusion in the Innovations budget for Measure A E. Shortlist questions should touch upon as many stages of the system as possible, while prioritizing areas that will have the biggest impact on meeting Measure A goals
Preference survey design
For priority B - ensuring the shortlist reflects co-design partner priorities - we used a tool we call the “preference survey”. It is a tool designed to produce a ranking of the longlist from most to least preferred.
Since it is impractical to survey people on 291 different questions and many questions in the longlist are very similar to one another, we create a consolidated list of questions. We grouped similar questions together under one, simplified evaluation question to produce a list of 102 unique, deduplicated questions that we sought to elicit preferences on. We call this the “consolidated longlist”. Since 102 is still a large amount, we use a survey tool that only requires participants to express a preference over one randomly selected pair of questions at a time.
The preference survey was fielded using the All Our Ideas platform. The tool presents respondents with randomized pairs of questions and asks them to choose which one they think is more important. That means that, for every time a participant votes on a pair of questions, we have a “winning” and “losing” question. We measure a question’s “popularity” based on the proportion of these randomized pairings it “wins” against a randomly matched question. Essentially, popularity can be interpreted as the probability that a question would be selected if compared at random to any other question.
Participants can vote as many times as they want, which helps surface not just which ideas people prefer, but how strong their preferences are: the more they vote, the more their preferences influence popularity. The tradeoff is that highly motivated respondents can cast many more votes than others, which tilts results toward those who are especially engaged. For this reason, we examine both the full set of votes and a version that limits influence from the most intensive voters.
Of those who received the preference survey, 139 people voted 4,837 times.
The plot below shoes the number of times those 139 people voted:
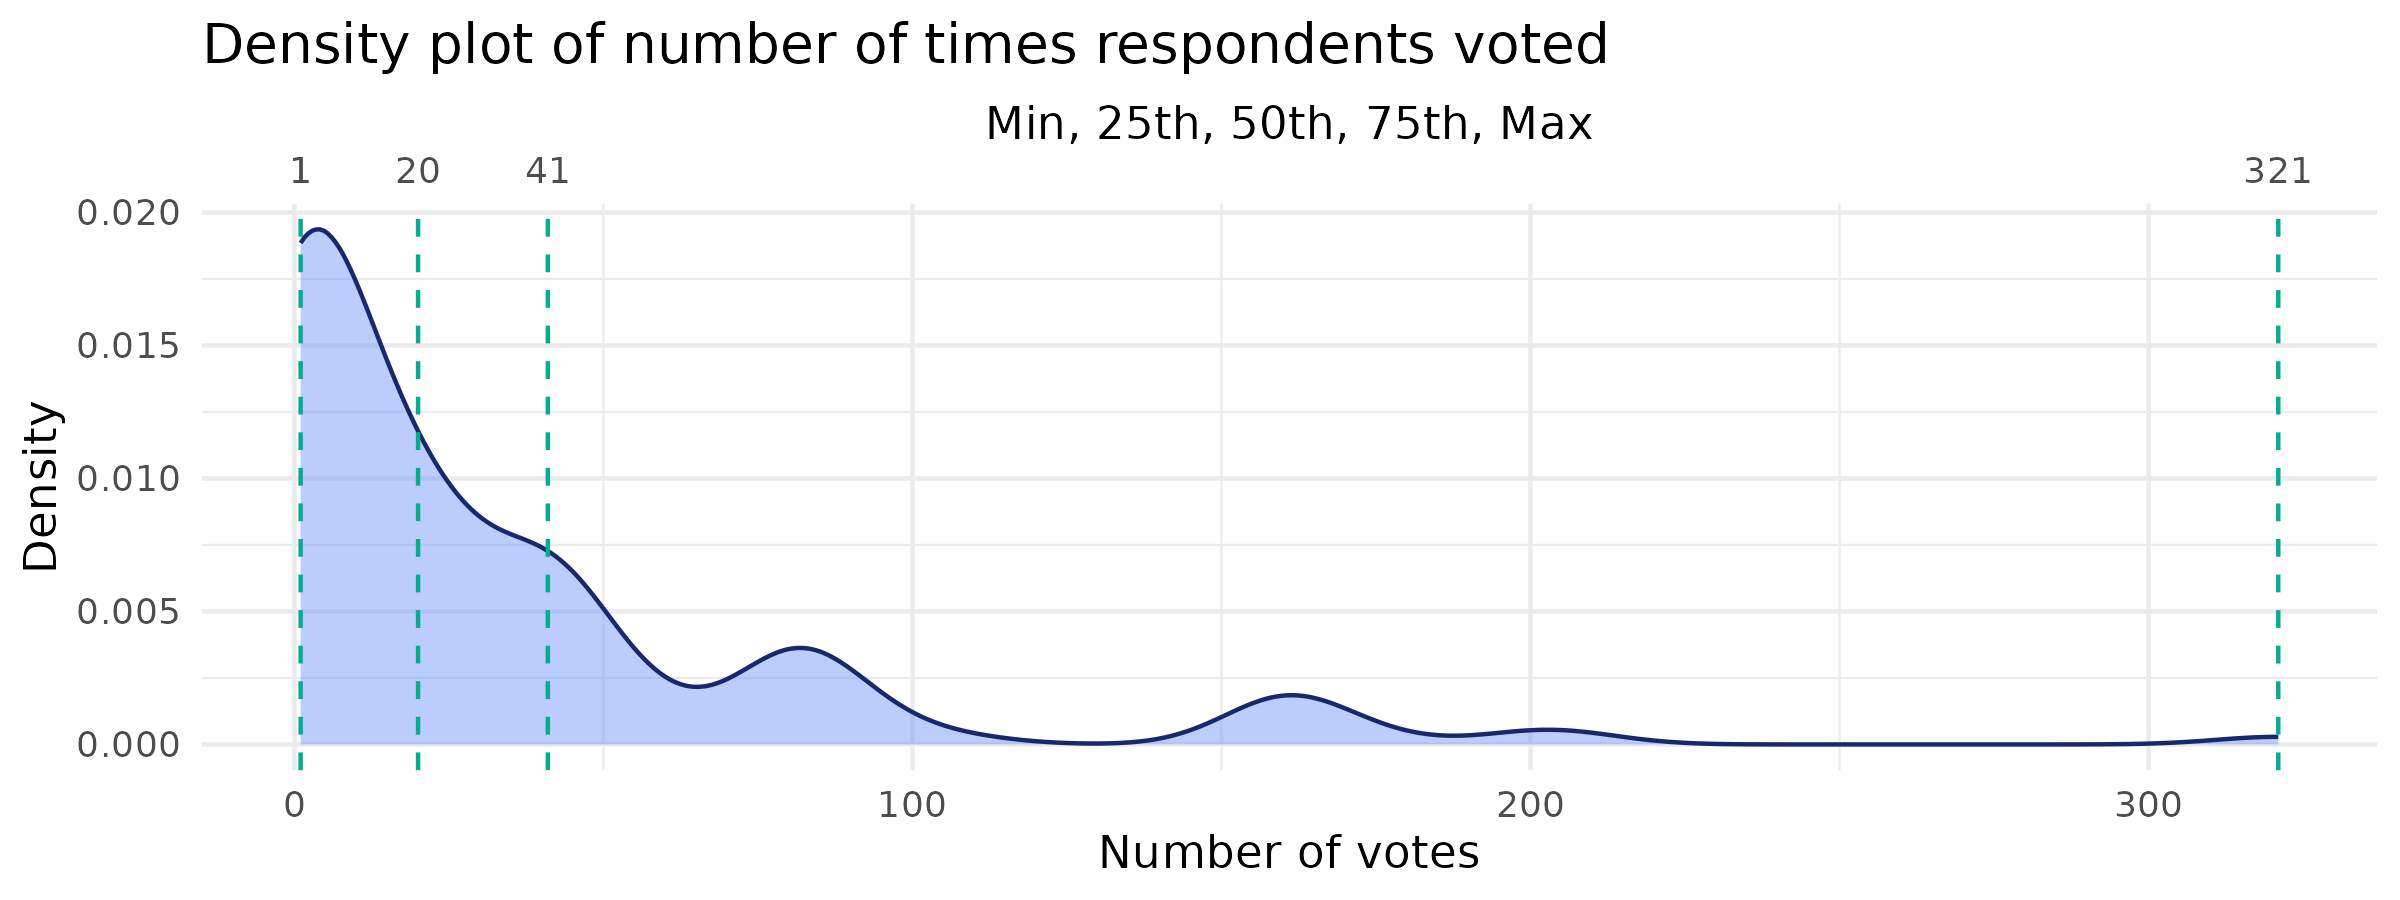
The median respondent voted 20 times. The vast majority (75%) cast 41 votes or fewer. One outlier voted 321 times. The distribution is heavily skewed to the right, as the plot above shows: the top 10% of voters account for nearly 46% of the votes cast.
To address the concern that intensive voters (i.e., the 10% who voted more than 83 times) might skew our view of the community’s preferences, we also calculate popularity excluding the top 10%. We call this “adjusted popularity”.
To get a sense of what it means for a question to be “popular”, it is helpful to look at the distribution of popularity and adjusted popularity over the consolidated longlist. The plots below show the min, median, max popularity and adjusted popularity, as well as the 25th and 75th percentiles.
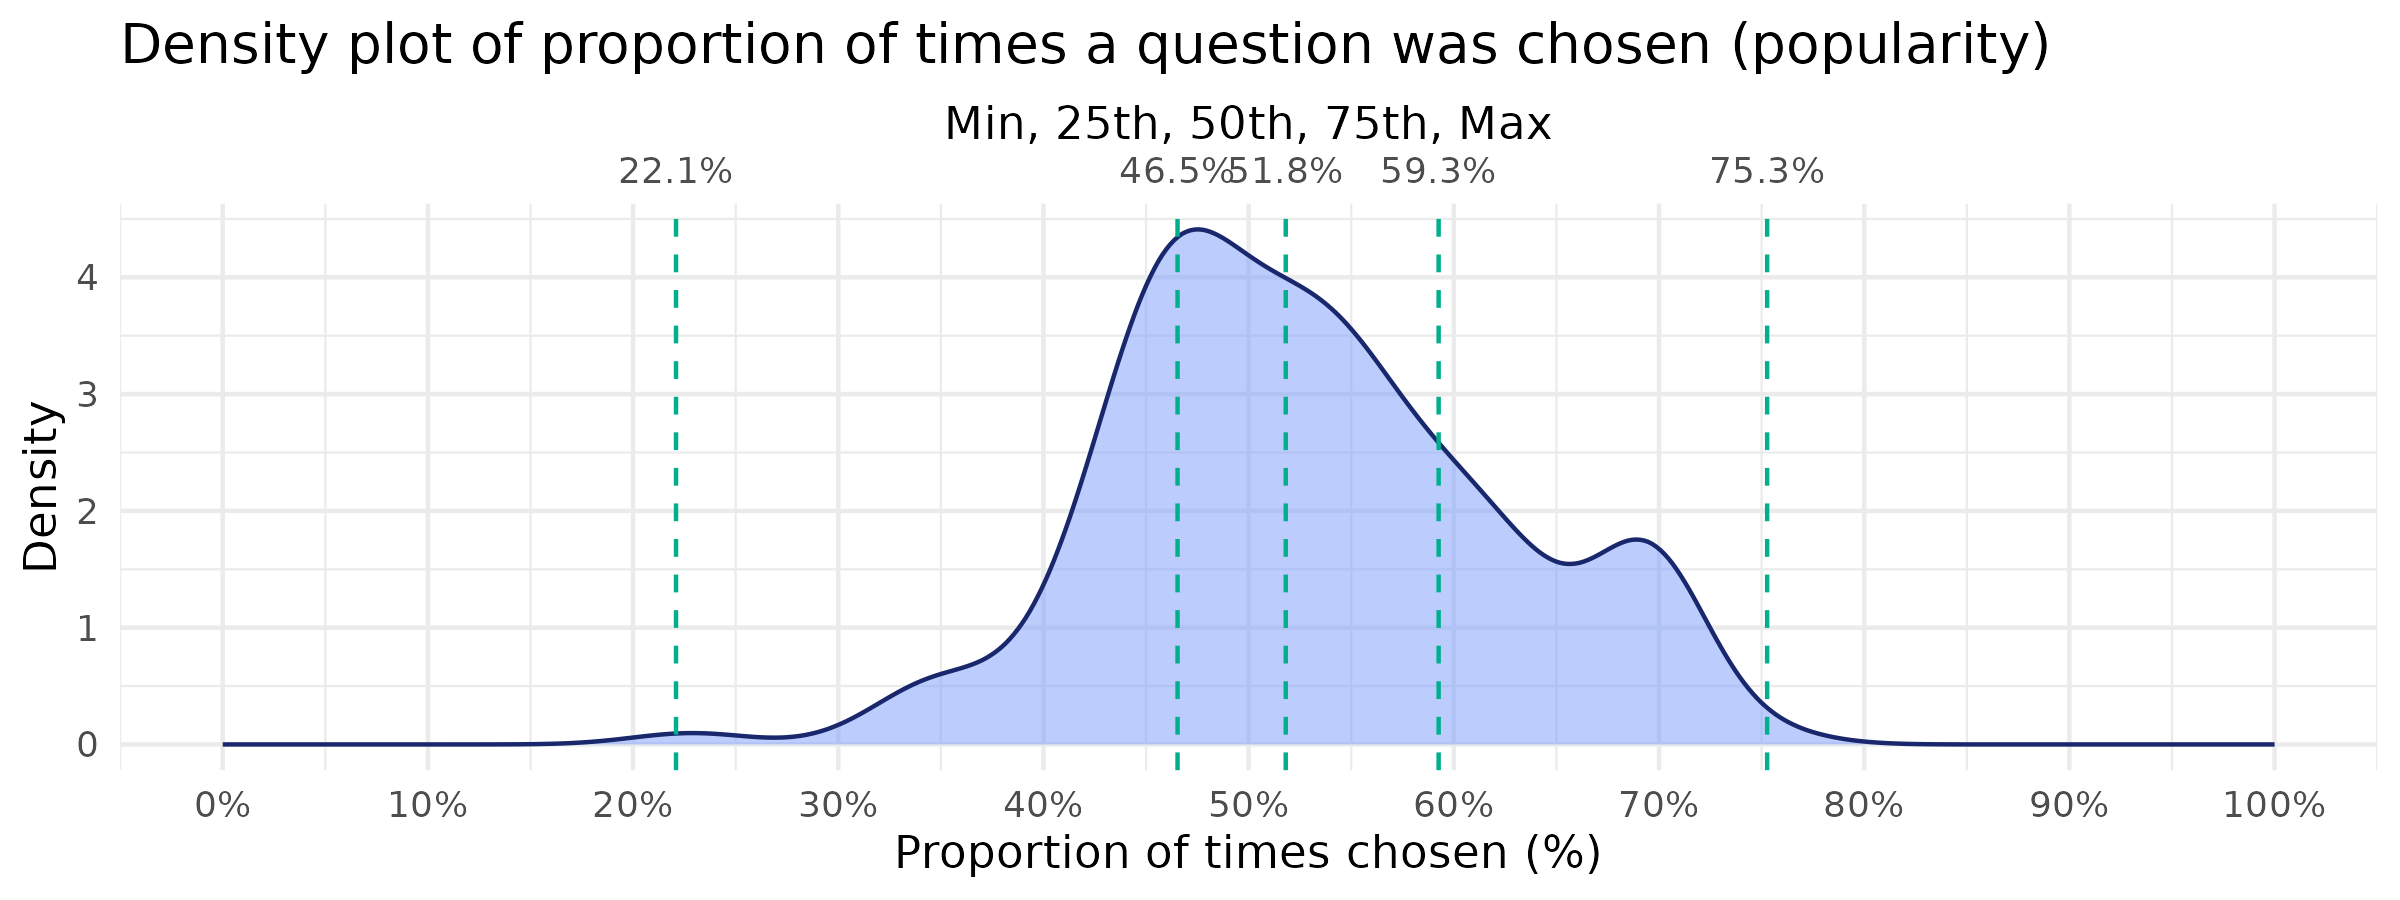
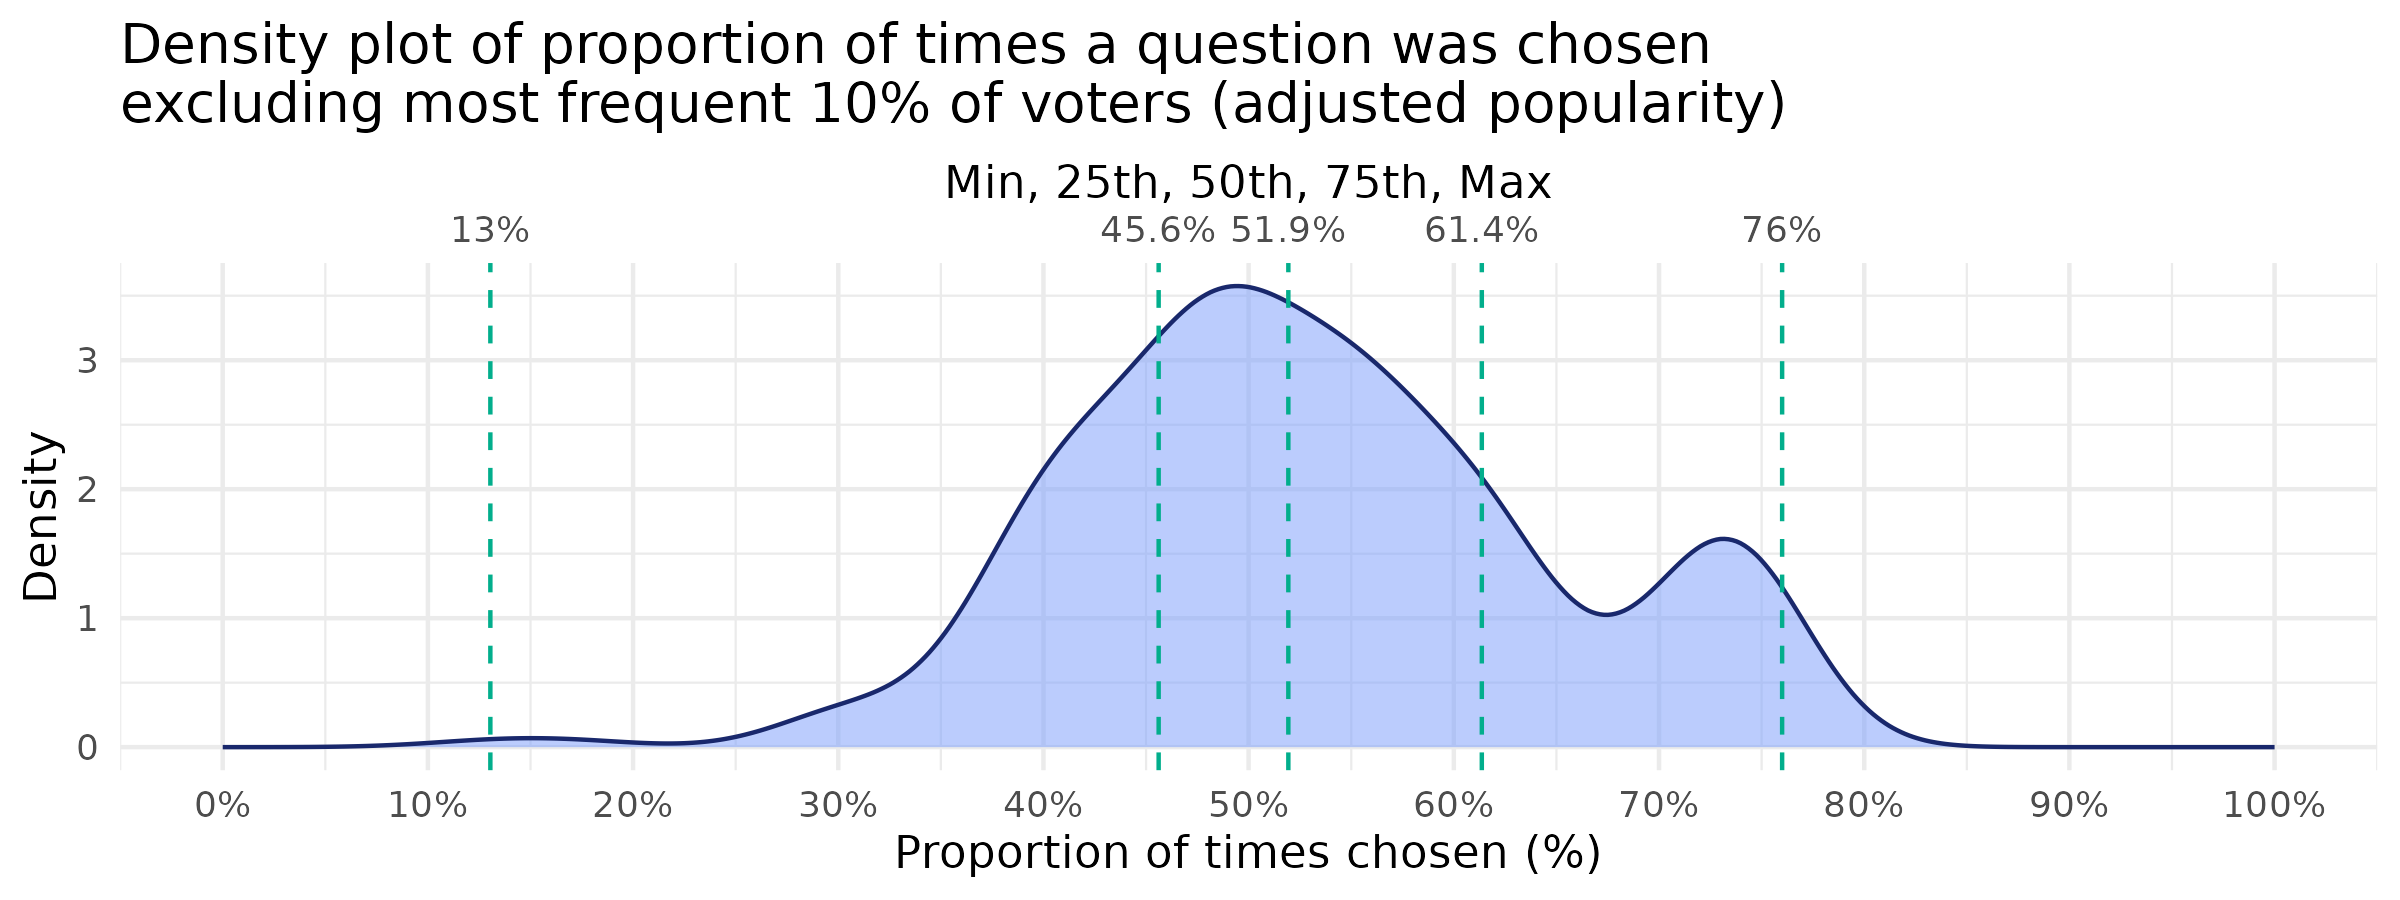
Using both plots to form some rules of thumb: the least popular 25% of questions only got chosen 13-47% of the time. So anything in that range can be considered unpopular. The most popular questions of all were up in the 60-76% range. Any question in that range can be considered “popular”.
The tables below show the top 10 most popular questions from the consolidated longlist. The first table uses the unadjusted popularity and second uses the adjusted popularity.
Top 10 most popular questions (unadjusted popularity, including all voters)
| Question from consolidated longlist | Popularity | Total votes | Strategy | Stage |
|---|---|---|---|---|
| What are the key factors that drive reentry into homelessness after prior successful exits, and how can this inform prevention strategies? | 75% | 93 | Helping people stay housed for the long term | Long-term housing stability |
| Which flexible funds (e.g., rent, utilities, transportation, childcare) most effectively prevent housing loss among at-risk households? | 71% | 91 | Preventing people from losing their housing in the first place | Prevention |
| How can referral and intake pathways be streamlined across agencies to reduce fragmentation, improve speed and match quality? | 70% | 100 | Improving how people move from one program to the next | Stabilization and progress through services |
| Which interventions accelerate exits from interim housing to permanent housing and reduce unfavorable exits? | 70% | 90 | Helping people move into permanent housing faster | Permanent housing placement |
| Where are widest gaps between system capacity and need for people experiencing homelessness with mental health and substance disorders? | 69% | 85 | Getting participants needed health and behavioral health care | Connection to services |
| Which mixes of housing models, case-management intensity, and health interventions produce the best long-term stability across subpopulations? | 68% | 85 | Testing, improving, and innovating program models | Cross-cutting system improvement |
| What outreach models most effectively connect people to housing and services? | 67% | 84 | Helping people living outside come indoors | Connection to services |
| Where does current system capacity fall short of what is required to meet Measure A goals? | 66% | 53 | Improving governance, coordination, and systemwide impact | Cross-cutting system improvement |
| What workforce strategies are most effective at building provider capacity and service quality in homelessness programs? | 64% | 90 | Supporting providers and provider workforce to deliver strong services | Cross-cutting system improvement |
| What factors predict early exits from permanent housing and residential care, and what interventions can prevent them? | 63% | 104 | Helping people stay housed for the long term | Long-term housing stability |
Top 10 most popular questions (adjusted popularity, excluding top 10% most frequent voters)
| Question from consolidated longlist | Adjusted popularity | Total votes | Strategy | Stage |
|---|---|---|---|---|
| Which mixes of housing models, case-management intensity, and health interventions produce the best long-term stability across subpopulations? | 76% | 50 | Testing, improving, and innovating program models | Cross-cutting system improvement |
| How can referral and intake pathways be streamlined across agencies to reduce fragmentation, improve speed and match quality? | 75% | 51 | Improving how people move from one program to the next | Stabilization and progress through services |
| What factors predict early exits from permanent housing and residential care, and what interventions can prevent them? | 75% | 51 | Helping people stay housed for the long term | Long-term housing stability |
| What prevention strategies are most effective at reducing new entries into homelessness across different populations and regions? | 74% | 57 | Preventing people from losing their housing in the first place | Prevention |
| Which interventions accelerate exits from interim housing to permanent housing and reduce unfavorable exits? | 73% | 49 | Helping people move into permanent housing faster | Permanent housing placement |
| What are the key factors that drive reentry into homelessness after prior successful exits, and how can this inform prevention strategies? | 72% | 47 | Helping people stay housed for the long term | Long-term housing stability |
| How does the quality of case management affect long-term client outcomes? | 71% | 52 | Providing the right support for different groups of people | Connection to services |
| How do time-limited and income- focused housing models compare across populations in improving income, retention, and long-term stability? | 71% | 52 | Testing, improving, and innovating program models | Cross-cutting system improvement |
| Which flexible funds (e.g., rent, utilities, transportation, childcare) most effectively prevent housing loss among at-risk households? | 70% | 53 | Preventing people from losing their housing in the first place | Prevention |
| What outreach models most effectively connect people to housing and services? | 66% | 47 | Helping people living outside come indoors | Connection to services |
Turning first to the top 10 questions according to unadjusted popularity, 9/10 are featured on the shortlist under upcoming evaluations. Among the top 10 according to the adjusted popularity, 7/10 were included on the shortlist. Questions that did not make it on focused on prevention, for which the Los Angeles County Affordable Housing Solutions Agency (LACAHSA) is the primary responsible party.
Governance partner priorities
Measure A requires the County consider recommendations on the AEA from ECRHA and that it consult with County agencies and departments. In addition, we included as governance partners in the AEA development process: subcommittees of the ECRHA; the LTRHA and its subcommittees, and County Board of Supervisors (BOS) staff and deputies.
Priorities from these partners were gathered through a combination of Brown Act meetings, staff-level meetings, surveys, and public reports and recommendations. The are reflected in the evaluation agenda under the “why prioritized” section of each proposed evaluation.
The Equity Subcommittee of the LTRHA and the BPSC Subcommittee of the ECRHA made specific recommendations on the AEA in public materials.
In their March, 2025 report, the Equity Subcommittee of the LTRHA recommended that the AEA prioritize:
- Developing more qualitative research to better understand the experiences of people receiving services and the barriers they face.
- Conducting studies on tenant retention in PSH and other permanent housing, especially for Black and AIAN tenants who have higher returns to homelessness after permanent placement.
- Investigating housing preservation strategies and targeting resources to communities of color to ensure equitable access to high-quality, affordable housing.
- Research into the intersectionality of populations and how individuals with multiple marginalized identities navigate the homelessness system.
- Developing a better understanding of the inflow of homelessness, especially focusing on those who self-resolve and exploring the reasons behind their ability to leave homelessness without formal support.
Recommendations 1 and 4 are incorporated into the evaluation principles and through the emphasis on qualititative methods for providing participants voice in the evaluations in the agenda. Recommendations 2 and 3 are implemented through the inclusion of a retention study with an explicit racial equity focus (Improving permanent housing retention and graduation). Recommendation 5 is partially addressed through evaluations on referral pathways, graduation from permanent supportive housing, and reentry into the homeless system among exiters. However, given its focus on prevention, this recommendation might be more fully explored in evaluation activities overseen by LACAHSA.
The Equity Subcommittee also made seven specific recommendations to include on the agenda during a focus group on October 5, 2025. Five of the seven are included in the shortlist. The two that did not make it on were on narrowly-scoped topics, including rental market discrimination (106) and the evidence base for institutional interventions (107).
In its recommendations to ECRHA in December 2025, the BPSC Subcommittee recommended the following questions included on the longlist be considered for inclusion on the AEA: 245, 271, 248, 247, 269, 246, 249, and 298. All of these are included in the shortlist under upcoming evaluations with three exceptions: 247, 248, and 298. Questions 247 and 248 pertain to services received in permanent supportive housing (PSH):
- How does access to on-site community-building and enrichment activities in project-based PSH influence tenant well-being, social connectedness, and long-term housing retention?
- How effectively do PSH programs collect and act on tenant feedback through surveys or listening sessions, and does meaningful responsiveness to feedback improve tenant satisfaction and stability?
While important, these questions were not included in the shortlist because their scope is relatively narrow and their relationship to key Measure A outcomes is indirect.
Question 298 concerns outreach engagement quality:
- How does the system assess the quality of engagement? Is the quantity of services/contacts associated with better outcomes? How do participants assess the quality of services?
It was not included on the shortlist again because the relationship to key outcomes under Measure A is indirect. Similar concerns – around participant experience with outreach and more generally – are reflected in questions included on the shortlist however.